|
Double Bar Graphs
|
High score: 0
|
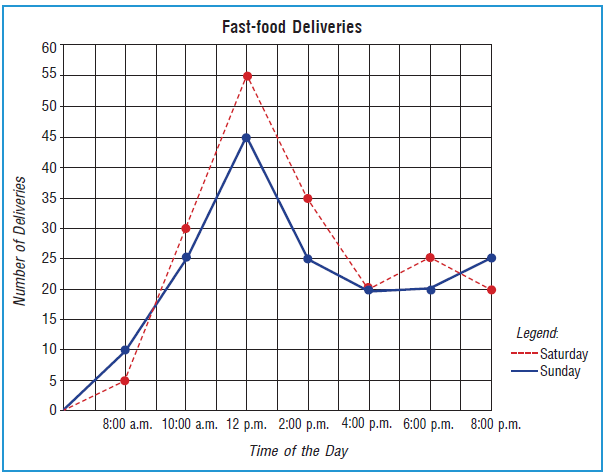
Use the graph to answer each question below. Choose the correct answer.
|
1.
|
What day were there more food deliveries at noon?
|
|
There were more deliveries on Saturday noon.
There were more deliveries on Sunday noon.
|
|
|
2.
|
At what time on Saturday was the most number of deliveries
made?
|
|
The greatest number of deliveries made on Saturday
were at 10:00 a.m.
The greatest number of deliveries made on Saturday
were at 2:00 p.m.
The greatest number of deliveries made on Saturday
were at 12:00 p.m.
|
|
|
3.
|
At what time on Sunday was the most number of deliveries made?
|
|
The greatest number of deliveries made on Sunday
were at 8:00 p.m.
The greatest number of deliveries made on Sunday
were at 12:00 p.m.
The greatest number of deliveries made on Sunday
were at 3:00 p.m.
|
|
|
4.
|
At what time on Sunday was the least number of deliveries made?
|
|
The least number of deliveries made on Sunday were
at 8:00 a.m.
The least number of deliveries made on Sunday were
at 4:00 p.m.
The greatest number of deliveries made on Saturday
were at 12:00 p.m.
|
|
|
5.
|
At what time on Saturday was the least number of deliveries
made?
|
|
The least number of deliveries made on Saturday
were at 8:00 a.m.
The least number of deliveries made on Saturday
were at 6:00 p.m.
The greatest number of deliveries made on Saturday
were at 12:00 p.m.
|
|
|
6.
|
Between which two times on Saturday was the change in the
number of
deliveries the greatest?
|
|
The change in the number of deliveries on Saturday
was
greatest between 8:00 a.m. to 10:00 a.m. and 10:00 a.m. to
12:00 p.m.
The change in the number of deliveries on Saturday
was
greatest between 12:00 p.m. to 2:00 p.m. and 2:00 p.m. to 4:00
p.m.
The change in the number of deliveries on Saturday
was
greatest between 8:00 a.m. to 12:00 p.m. and 4:00 p.m. to 6:00
p.m.
|
|
|
7.
|
Between which two times on Sunday was the change in the
number of deliveries the greatest?
|
|
The change in the number of deliveries on Sunday was greatest between 10:00 a.m. to 12:00 p.m. and 12:00 p.m. to 2:00 p.m.
The change in the number of deliveries on Sunday
was greatest
between 12:00 p.m. to 4:00 p.m. and 6:00 p.m. to 8:00 p.m.
The change in the number of deliveries on Sunday
was greatest
between 8:00 a.m. to 10:00 p.m. and 10:00 a.m. to 11:00 a.m.
|
|
|
8.
|
At which time was the number of food deliveries the same?
|
|
The number of food deliveries was the same at 8:00 p.m.
The number of food deliveries was the same at 12:00 p.m.
The number of food deliveries was the same at 4:00 p.m.
|
|
|
9.
|
What can you infer from the graph?
|
|
The most number of food deliveries was at 8:00 on both days.
The most number of food deliveries were made at 12:00 p.m.
There were more food deliveries on Sunday than on Saturday.
|
|
|
10.
|
What can you conclude from graph?
|
|
Most customers prefer food deliveries at 12:00 p.m. in time for lunch.
Most customers prefer food deliveries at 8:00 p.m. in time for dinner.
More customers prefer food deliveries at 12:00 p.m. on Sunday than on Saturday.
|
|