Correct Answers:
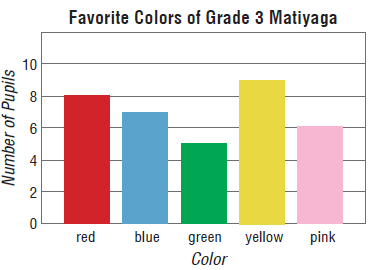
| 1. | What is the title of the graph? | |
|
Favorite Colors of Grade 3 Matiyaga
Number of Grade 3 Pupils
Color
|
||
| 2. | How many pupils like the color yellow? | |
|
7 pupils
8 pupils
9 pupils
|
||
| 3. | What color is the least favorite? | |
|
green
yellow
pink
|
||
| 4. | How many grade 3 pupils are there in Section Matiyaga? | |
|
35 pupils
30 pupils
40 pupils
|
||
| 5. | How more pupils like the color yellow than the color green? | |
|
6 pupils
5 pupils
4 pupils
|
||