|
Interpreting Data in Tables and Bar Graphs
|
High score: 0
|
A. The table presents Bryan’s weekly savings for a certain month. Answer each question about the table. Fill in the blank with the correct answer.
|
||||||||||||
| 1. |
How much was saved during the first week?
₱
|
|||||||||||
| 2. |
How much was saved during week 3?
₱
|
|||||||||||
| 3. |
During which week did Bryan save ₱90?
week
|
|||||||||||
| 4. |
How much more was saved on week 3 than on week 1?
₱
|
|||||||||||
| 5. |
How much more was saved on week 2 than on week 4?
₱
|
|||||||||||
| 6. |
How much was saved during the month?
₱
|
|||||||||||
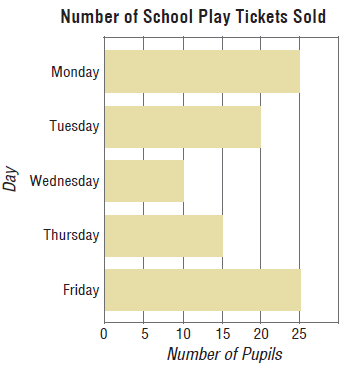
B. Use the data presented in the graph to complete each statement. Choose the correct answer
|
||
| 7. | What is the title of the graph? | |
|
Day
Number of School Play Tickets Sold
Number of Pupils
|
||
| 8. | How many tickets were sold on Monday? | |
|
25 tickets
20 tickets
10 tickets
|
||
| 9. | On what day was the least number of tickets sold? | |
|
Monday
Tuesday
Wednesday
|
||
| 10. | How many more tickets were sold on Friday than on Thursday? | |
|
10 tickets
5 tickets
15 tickets
|
||
| 11. | How many tickets were sold during the week? | |
|
100 tickets
95 tickets
110 tickets
|
||