|
Interpreting Data in Tables and Bar Graphs
|
High score: 0
|
A. Use the data presented in the table to answer the questions that follow. Choose the correct answer.
|
||||||||||||||||||
| 1. | What data is presented in the table? | |||||||||||||||||
|
favorite ice cream flavors of some pupils
ice cream flavors
favorite flavors of some pupils
|
||||||||||||||||||
| 2. | How many pupils were asked in the survey? | |||||||||||||||||
|
80 pupils
100 pupils
82 pupils
|
||||||||||||||||||
| 3. | How many pupils prefer mango? | |||||||||||||||||
|
16 pupils
20 pupils
24 pupils
|
||||||||||||||||||
| 4. | How many pupils prefer strawberry? | |||||||||||||||||
|
20 pupils
12 pupils
10 pupils
|
||||||||||||||||||
| 5. | Which ice cream flavor is favored by the greatest number of pupils? | |||||||||||||||||
|
mango
strawberry
chocolate
|
||||||||||||||||||
| 6. | Which ice cream flavor is least favored? | |||||||||||||||||
|
strawberry
chocolate
ube
|
||||||||||||||||||
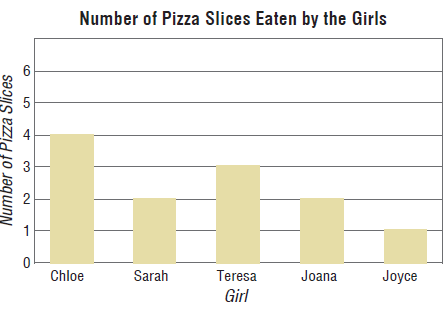
B. Use the data presented in the graph to complete each statement. Choose the correct answer
|
||
| 7. | The graph is about | |
|
number of pizza slices
number of pizza slices eaten by 5 girls
number of pizzas eaten by girls
|
||
| 8. | ate the most number of pizza slices. | |
|
Chloe
Teresa
Joyce
|
||
| 9. | and ate the same number of pizza slices. | |
|
Chloe and Teresa
Sarah and Joana
Sarah and Joyce
|
||
| 10. | The girls ate slices of pizza in all. | |
|
10
8
12
|
||